Watch and follow the instructions of this selective attention test:
(Simons, 1999)
If you had not viewed this video before and you were surprised by what you did not see the first time through, you aren’t the first. We are all victims of what is known as “selective attention”. Research indicates that attention is a resource that is very limited. Because of this, our brains focus on what we have been told (or that we believe) is the most important information even if multiple options of information are available to us. But a gorilla would seem to be a very important piece of visual information! So, how do we not see it? We simply stay fixated on the task given: count the white passes.
And so it is with lactate threshold. Lactate threshold can easily be interpreted as the point on the plotted line where lactic acid value begins to increase rapidly in the blood. Easy enough.
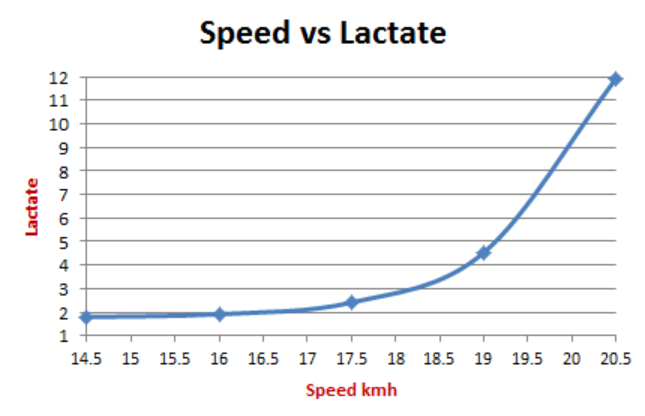 The Y axis of the chart is blood lactate measured in mmol/L. The X axis is speed in km/h. Look at the line. Where does it start to increase rapidly? Typically the answer is somewhere around 4 mmol/L, and that is confirmed by what we see on this chart. Again, easy enough. But did you see how glycolysis was converting food into energy?
Look again:
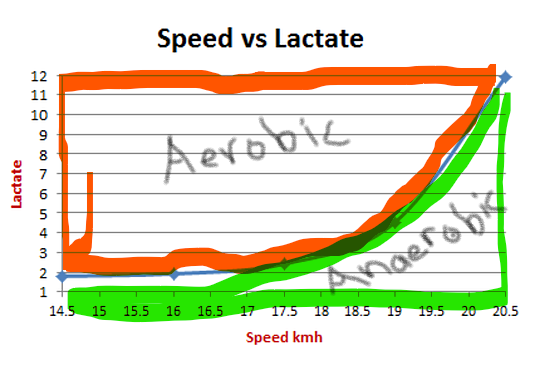 What do you see now (besides what appears to be a graph highlighted by a potato)? Two energy systems, of course (let’s pretend CP doesn’t play a role in this scenario do to its extremely minute contributions). While the line of mmol/L acid is often what we selectively attend to, what we really miss out on is how glycolysis is functioning to keep us moving faster and faster while going further and further. You have to ask yourself, have you ever looked at a lactate threshold graph in this manner? If not, again, you are not alone. But why would moving our attention to aerobic and anaerobic glycolysis matter? Let’s discuss.
First, we need to define the function of glycolysis in producing pyruvate, NADH, and ATP (If you know these terms, great. If not, no worries in relation to today’s blog). In aerobic glycolysis, the byproducts produced into the blood are carbon dioxide and water. The byproduct of anaerobic glycolysis is lactate. When glucose stores are no longer able to keep utilizing oxygen due to increased demand, lactate levels in the blood begin to rapidly rise. But, when we take our eyes off of the line and look at what is around it we can see that lactate is already present in the blood from the beginning. This tells us that we derive energy for movement from both sources at nearly all times. It is easy to see the anaerobic contribution in the green area highlighted under the line. In an endurance athlete, we see the orange area taking up a large amount of the graph at the outset. Again, all pretty easy to understand even if we have not focused on the “space” in the graph before.
Most “endurance” coaches and athletes are always looking for ways to move the orange in the chart to the right and down. This indicates a clear improvement in aerobic training, right? Well, maybe. Let’s not forget that the anaerobic system is also being trained in doses dependent on the focus of the athlete and coach. So what if a coach focuses more on the athlete’s training on building anaerobic power and endurance. Well, the green (anaerobic) portion of the chart would likely shift slightly to the left and higher at the same speed. Does this mean the athlete is less fit? Not if the goal is to run fast in events 400m-1500m. Anaerobic power produces more forceful, albeit less efficient, muscle contractions. These powerful contractions contribute to a much faster pace in these shorter races. They also contribute to mind-numbing, butt-cheek clenching lactic acid walls. Fatigue approaches failure at a much faster rate. But this is necessary to be competitive at these distances.
A high school coach may do double duty of cross country in the fall, followed by track in the spring. It is important to make sure that you are not so focused on the “line” that you forget the energy contributions pushing that line up, down, and side to side. The power and efficiency of the muscles (based on what fuels them form the blood) will determine your performance at any race distance.
Don’t get so fixated on one thing that you forget to take time to look for the gorillas.
– Ben
As always, if you are enjoying the blog posts, please follow us on Facebook, Twitter, and Instagram by clicking on the icons below. You can also sign-up for emails for training and product promotions. Don’t hesitate to connect in any of these multiple ways if you have an interest in any of our performance testing or assisting you in creating training plans for your next big race.
Stay tuned for the next blog: Why none of this really matters and the importance of throwing the dart at the right target.